Measures
Measures are the building blocks of Analytics 360 — named, reusable aggregation definitions that turn raw tagged events into countable, measurable units. A measure captures what to count (which events, under which conditions) without prescribing where it is displayed. Once defined, a measure can feed into multiple visualizations, power calculated metric expressions, and serve as a consistent vocabulary for the events that define your sport.
Overview
The Measures tab operates in two modes: a list view showing every measure you have defined, and an editor view for creating or modifying individual measures.
List View
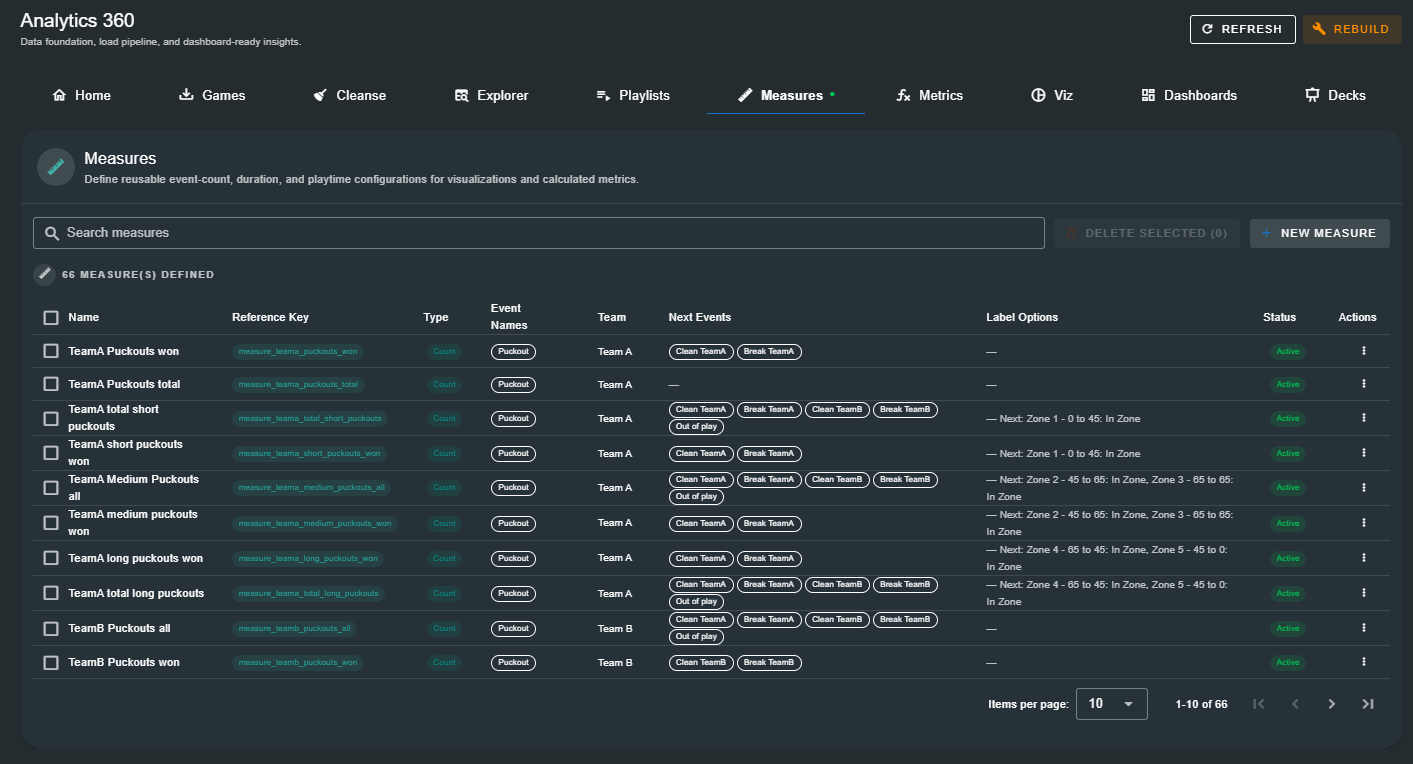
When measures exist, the list view displays a table with the following columns:
| Column | Description |
|---|---|
| Name | The human-readable name of the measure (e.g. "Team A Puckouts Won"). Click any row to open the editor. |
| Reference Key | A unique, auto-generated key used to reference the measure in calculated metric expressions (e.g. measure_teama_puckouts_won). Displayed as a blue chip. |
| Type | The measure type — Count, Duration, or Distance. Colour-coded chip. |
| Event Names | The event types this measure aggregates. Chips show each selected event; "All events" when none are specified. |
| Team | The team filter, if any. |
| Next Events | Any next-event filters applied. Shows event chips plus an optional team qualifier. |
| Label Options | Any label:option filters applied to the primary event or next event. |
| Status | Active (green) or Inactive (grey). Inactive measures are ignored by visualizations and metrics. |
| Actions | Kebab menu (⋮) with Edit, Copy, and Delete options. |
Above the table, a search bar filters measures by name in real time. A count badge shows the total number of defined measures (e.g. "66 Measure(s) Defined").
Empty State
When no measures have been defined, the page displays a prompt to create your first one — with a reminder that measures can be reused across visualizations and referenced in calculated metric expressions.
Measure Types
Analytics 360 supports three measure types, each serving a different analytical purpose:
| Type | Description | Example Use Case |
|---|---|---|
| Count | Counts the number of events matching the configured filters. The most common type. | "Total Tackles", "Passes into the 22", "Turnovers Won in Midfield" |
| Duration | Sums the duration of matching events. Useful when events carry a time component (e.g. possession events). | "Total Time in Possession", "Time Spent in Attacking Third" |
| Distance | Computes the distance between matched start → end event pairs using position data. | "Distance Covered from Puckout to Shot", "Ball Progression per Possession" |
Count is the default and most frequently used type. Start here — you can always create Duration or Distance measures later when your analysis requires time-based or positional insights. :::
Creating a Measure
Click New Measure (or Create Your First Measure when the list is empty) to open the editor.
Core Settings
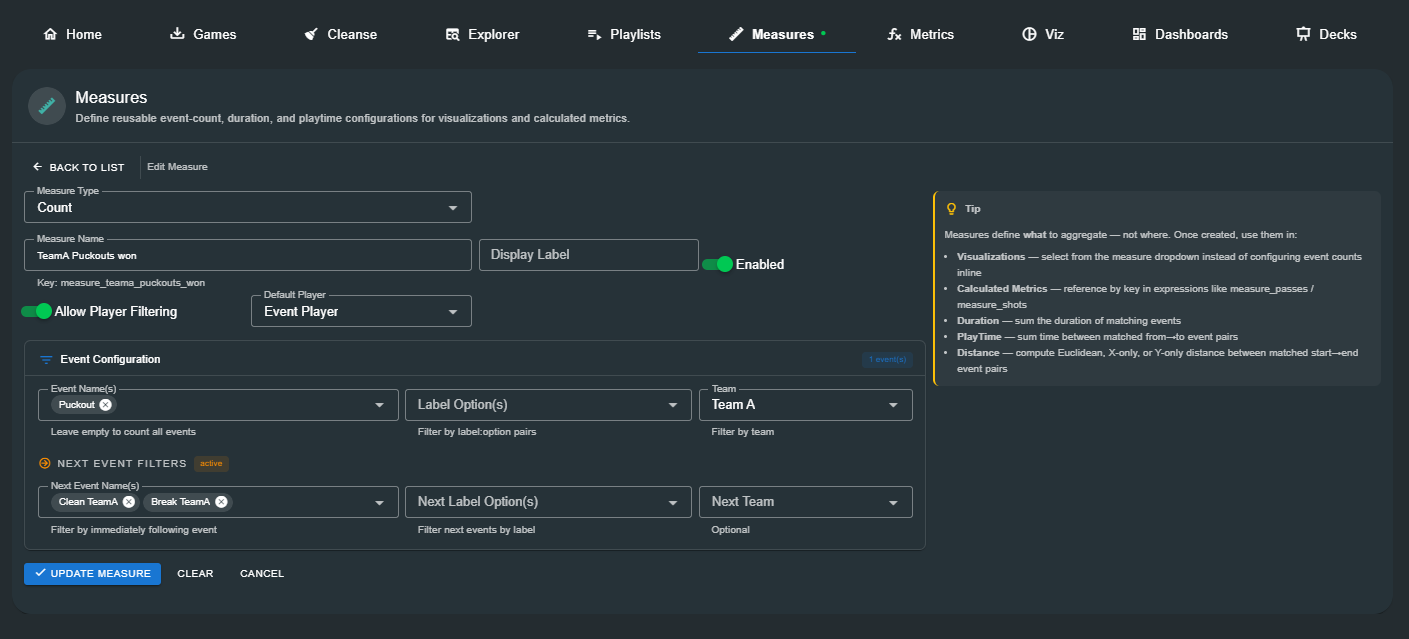
Every measure, regardless of type, shares these common fields:
| Field | Description |
|---|---|
| Measure Type | Select from Count, Duration, or Distance. This determines which event configuration fields appear below. |
| Measure Name | A descriptive name for the measure (e.g. "Team A Puckouts Won"). Required. |
| Display Label | An optional shorter label for use in charts and tables where space is limited (e.g. "Puckouts Won"). |
| Enabled | Toggle to activate or deactivate the measure. Disabled measures are preserved but excluded from visualizations and metrics. |
| Allow Player Filtering | (Count only) When enabled, visualizations using this measure can be filtered by player. When disabled, the measure always aggregates across all players. |
| Default Player | (Count only, when player filtering is enabled) Determines the default player scope — Event Player (the player on the event) or a specific player. |
The Reference Key is auto-generated from the measure name and type — for example, a Count measure named "Team A Puckouts Won" produces the key measure_teama_puckouts_won. This key is how calculated metrics reference the measure in expressions.
Event Configuration — Count
Count measures filter which events are aggregated. The Event Configuration card provides the following controls:
| Field | Description |
|---|---|
| Event Name(s) | Select one or more event types to count. Leave empty to count all events — useful for a "Total Events" measure. |
| Label Option(s) | Filter by label:option pairs (e.g. "Shot type:From play"). Only events carrying the specified label-option combinations are counted. |
| Team | Restrict counting to events performed by a specific team. Leave blank to count across both teams. |
Next Event Filters
Next Event Filters constrain the measure to only count events whose immediately following event matches specified criteria. This unlocks sequence-based measures:
| Field | Description |
|---|---|
| Next Event Name(s) | The type(s) of the following event. For example, set to "Clean TeamA" to count Puckouts that were followed by a clean win. |
| Next Label Option(s) | Filter the following event by label:option pairs. |
| Next Team | Restrict the following event to a specific team. |
A green active chip appears beside the Next Event Filters heading whenever at least one next-event constraint is configured — giving you a quick visual indication that the measure uses sequence logic.
Next Event Filters are what turn "Total Puckouts" into "Puckouts Won" — by requiring the following event to be a clean possession for the same team. This is one of the most powerful filtering capabilities in Analytics 360. :::
Event Configuration — Duration
Duration measures have a simplified configuration:
| Field | Description |
|---|---|
| Team | Filter by the team that performed the event. |
| Event | Select one or more event types whose durations will be summed. |
Event Configuration — Distance
Distance measures define from → to event pairs and compute the distance between their positions:
| Section | Field | Description |
|---|---|---|
| From Event | From Team | The team performing the starting event. |
| From Event | The starting event type(s). | |
| To Event | To Team | The team performing the ending event. |
| To Event | The ending event type(s). | |
| Distance Calculation | Distance Mode | How to compute the distance: Euclidean (straight-line), X-only (horizontal), or Y-only (vertical). |
Tips Panel
The right-hand panel displays contextual guidance:
Measures define what to aggregate — not where. Once created, use them in:
- Visualizations — select from the measure dropdown instead of configuring event counts inline
- Calculated Metrics — reference by key in expressions like
measure_passes / measure_shots- Duration — sum the duration of matching events
- Distance — compute Euclidean, X-only, or Y-only distance between matched start→end event pairs
Saving a Measure
Once you have configured the measure:
- Click Update Measure (or Save Measure for new measures).
- A success message confirms the save.
- Click Back to List to return to the list view, or Clear to reset the form and create another.
The new measure appears immediately in the list and is available for use in visualizations and calculated metrics.
Changes to measures take effect immediately. If you modify a measure that is already used in visualizations or calculated metrics, those downstream consumers will reflect the updated definition the next time they are rendered or recomputed. :::
Managing Measures
Editing
Click any row in the list view, or use the kebab menu (⋮) → Edit, to open the measure in the editor. Make your changes and click Update Measure.
Copying
Use the kebab menu (⋮) → Copy to duplicate a measure. The editor opens pre-populated with the original measure's configuration and an empty ID — make adjustments, provide a new name, and save to create a variant. This is useful when you need several similar measures (e.g. "Puckouts Won" for Team A and Team B).
Deleting
Use the kebab menu (⋮) → Delete to remove a measure. Analytics 360 checks whether the measure is referenced by any visualizations or calculated metrics before allowing deletion. If the measure is in use, the dialog lists every consumer that references it and blocks the deletion until those references are removed.
Auto-generated measures (created during game loading via the Auto-Load Configuration) may be re-created on the next game load if deleted. The bulk delete dialog warns you when auto-generated measures are among the selection. :::
Bulk Delete
Check multiple rows in the list view and click Delete Selected (n). The dependency check runs against all selected measures — any that are in use are listed with the blocking consumers, and only the safe-to-delete measures are removed.
Searching
The search bar at the top of the list filters measures by name in real time. Use it to quickly locate a specific measure in large configurations.
How Measures Connect
Measures sit at the centre of the Analytics 360 data model — they bridge raw events and every downstream consumer:
Tagged Events  →  Measures  →  Visualizations (KPIs, charts, tables)
                            →  Calculated Metrics (expressions)
A single measure can power a KPI card, a bar chart, a data table, and a calculated metric — all simultaneously. This means you define the aggregation logic once and reuse it everywhere, ensuring consistency across your entire analytics environment.
Next Steps
With measures defined, you are ready to build higher-level analytics:
- Metrics — Create calculated metrics that combine measures into performance indicators
- Viz — Design visualizations powered by your measures
- Dashboards — Assemble visualizations into structured dashboards
- Decks — Build presentation decks for meetings and reviews