Home
The Home tab is your Analytics 360 landing page — a high-level dashboard that surfaces the state of your entire analytics environment at a glance. From here you can see what is loaded, what has been built, and where to go next.
Overview
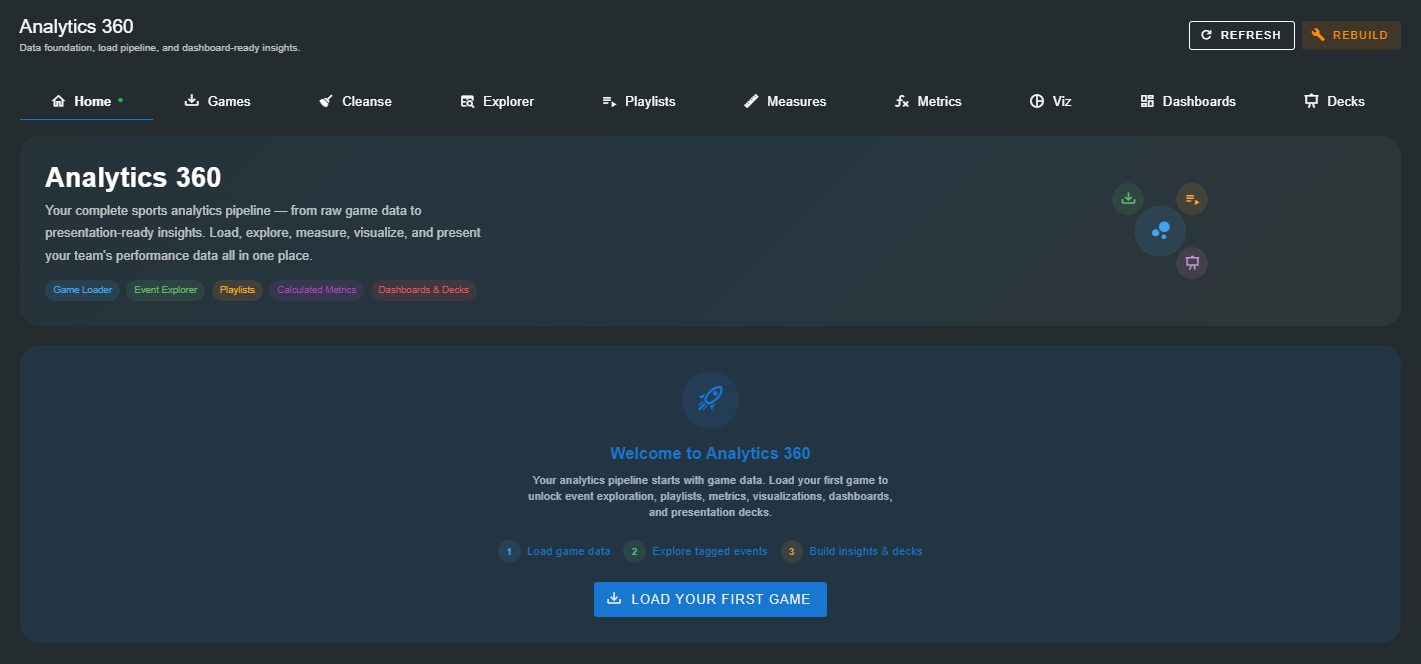
When you first open Analytics 360 with no games loaded, Home presents a guided setup flow with clear next steps. Once you have loaded games, Home transforms into a pipeline summary that tracks your progress through every stage of analysis — from data import to presentation.
What You See
Home is divided into three zones:
| Zone | Description |
|---|---|
| Pipeline Summary | A visual workflow showing each stage of the analytics pipeline with live counts — how many games are loaded, how many events are available, how many metrics have been defined, and more. |
| Summary Cards | Six stat cards displaying the current totals for loaded games, total events, playlists, calculated metrics, dashboards, and decks. |
| Quick Access | Direct links to your most recently used dashboards, playlists, and decks — or guidance on creating your first one if none exist yet. |
Pipeline Summary
The pipeline summary maps your progress across the six core stages of the Analytics 360 workflow:
| Stage | What It Tracks | Example |
|---|---|---|
| Import | Number of games loaded into the analytics database. | 5 games |
| Explore | Total event count across all loaded games. | 1,896 events |
| Highlight | Playlists created from tagged events. | 0 playlists |
| Define | Calculated metrics defined from measures. | 21 metrics |
| Visualize | Visualizations built from measures and metrics. | 10 viz |
| Present | Dashboards and decks assembled for sharing. | 0 dashboards, 0 decks |
Each stage card acts as a shortcut — click any stage to jump directly to the corresponding tab.
Summary Cards
Six cards beneath the pipeline summary provide an at-a-glance view of your analytics environment:
| Card | Description |
|---|---|
| Games Loaded | The number of games currently loaded into Analytics 360. Matches the count shown in the Games tab. |
| Total Events | The total number of tagged events across all loaded games, after cleanse rules have been applied. |
| Playlists | The number of playlists you have created. |
| Calc Metrics | The total number of calculated metrics defined in the Metrics tab. |
| Dashboards | The number of dashboards you have assembled. |
| Decks | The number of presentation decks you have built. |
Each card displays a single large number — zeroes are shown in a muted style to indicate areas you have not yet explored.
Quick Access
The Quick Access panel provides direct entry points to your most important content:
- Dashboards — Links to your recently viewed or edited dashboards. When no dashboards exist, the panel displays a prompt to create your first one in the Dashboards tab.
- Playlists — Links to your recent playlists, or a prompt to build your first one in the Playlists tab.
- Decks — Links to your recent presentation decks, or a prompt to create your first one in the Decks tab.
Getting Started from Home
If this is your first time using Analytics 360, Home guides you through three steps:
- Load a game — Click the Load Games prompt or navigate to the Games tab to import your first tagged match.
- Explore your data — Once a game is loaded, head to the Explorer to browse events.
- Build insights — Create measures, metrics, and visualizations to surface the patterns that matter.
Once you have content in the pipeline, Home becomes a convenient launchpad — use it to monitor your environment and jump directly to any workspace.
Next Steps
Home is the entry point. Follow the pipeline from here: